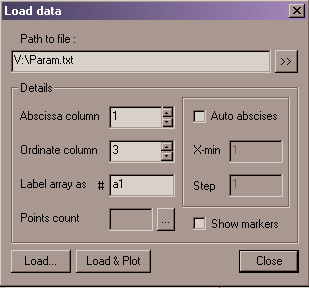
Use Command -> Load array to open the Load data dialog.
Browse for the file path.
If necessary, сheck in auto-abscises mode, and specify the first-point abscissa value and the step.
Specify column number for abscises (if auto-abscises is off) and for ordinates.
Check in show markers if you want to mark points when plotting the graph.
You must give array a name (label). The label will be used to specify array in the Graph Plotting window. Array label must start with the # character. ArtSGraph generates names automatically for consequently loaded arrays - #a1, #a2, #a3, etc., however you can change the proposed name.
You can also check number of points in the file by clicking the Points count button.
Finally, click Load button. ArtSGraph loads array and associates it with the label specified. It refreshes the dialog and generates the next name, so you can load another array.
Click Close button if you need not to load more arrays.
Instead of Load you can click Load and Plot. In this case ArtSGraph will load the array, open a new Graph Plotting window, define a new graph in this window based on array data and plot it.
Arrays are used for plotting graphs of three types – broken line, 3rd order spline and chi-square approximating curve. For the cases of spline and chi-square abscissas in the array must be ordered strictly ascending.
See more details of graphical representation of array data in Using Graph Windows section.